PGFPlots - A LaTeX Package to create normal/logarithmic plots in two and three dimensions.
Create normal/logarithmic plots in two and three dimensions for LaTeX/TeX/ConTeXt
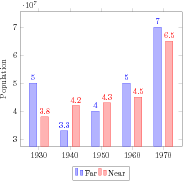
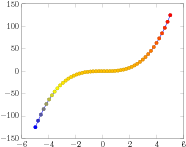
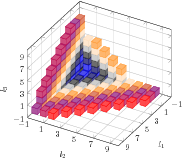
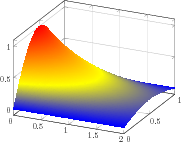
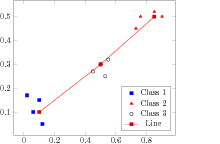
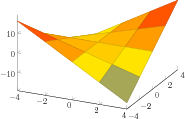
PGFPlots draws high-quality function plots in normal or logarithmic scaling with a user-friendly interface directly in TeX. The user supplies axis labels, legend entries and the plot coordinates for one or more plots and PGFPlots applies axis scaling, computes any logarithms and axis ticks and draws the plots, supporting line plots, scatter plots, piecewise constant plots, bar plots, area plots, mesh-- and surface plots and some more.
It has been developed as a spare time project by
Christian Feuersänger.
Pgfplots is based on PGF/TikZ
This package provides tools to generate plots and labeled axes easily. It draws normal plots, logplots and
semi-logplots, in two and three dimensions. Axis ticks, labels, legends (in case of multiple plots) can be
added with key-value options. It can cycle through a set of predefined line/marker/color specifications. In
summary, its purpose is to simplify the generation of high-quality function and/or data plots, and solving
the problems of
-
consistency of document and font type and font size,
-
direct use of TEX math mode in axis descriptions,
-
consistency of data and figures (no third party tool necessary),
-
inter document consistency using preamble configurations and styles.
Although not necessary, separate .pdf or .eps graphics can be generated using the external library developed as part of TikZ.
You are invited to use pgfplots for visualization of medium sized data sets in two- and three dimensions.
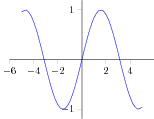
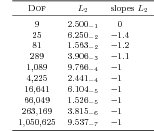
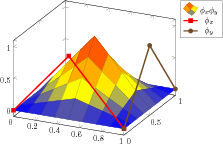
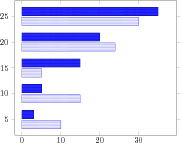
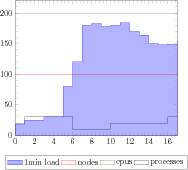
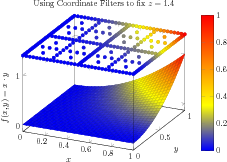
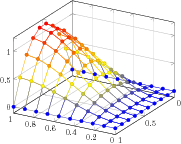
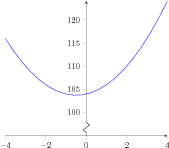
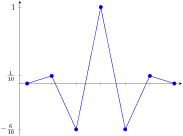
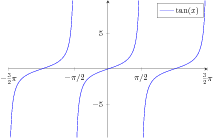
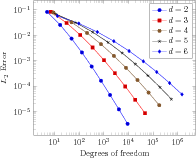
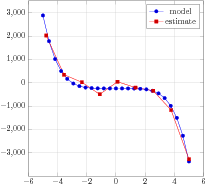
Sample images
Download and Installation
PGFPlots is freely available and might already be part of your LaTeX Distribution.
If not, download it from
 and follow the instructions in the pgfplots.pdf manual.